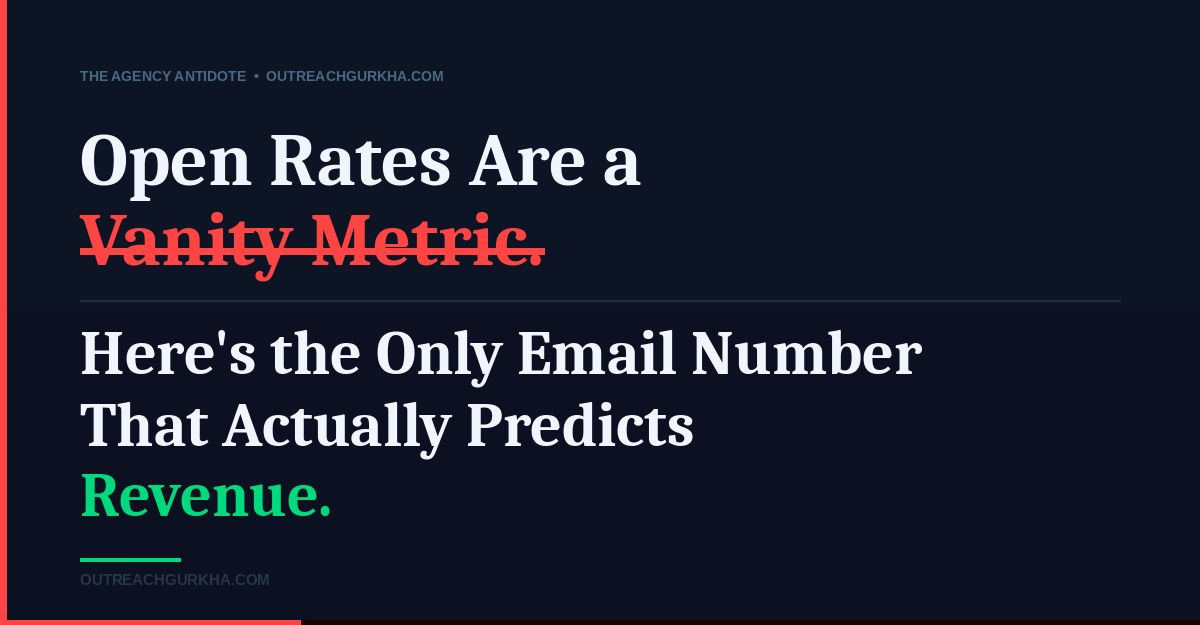
Open Rates Are a Vanity Metric. Here’s the Only Email Number That Actually Predicts Revenue.
Your agency sends you a report every month. Open rate: 42%. Click rate: 3.8%. They call it a strong month. Your revenue from email: $1,900. It should be $9,000. The report never mentions that.
Your email agency sent you a report last month.
It had a graph. Open rates were up. The subject line they split-tested performed 18% better than the control. Click-through rate held steady. Unsubscribe rate was clean. They called it a good month.
You made $1,900 from email.
That number was not in the report.
This is not an accident. Agencies have known for years that open rates look impressive regardless of whether any money changes hands. A 45% open rate on a list of 10,000 people means 4,500 inboxes were touched. It tells you nothing about whether a single one of them bought something.
This article is about the gap between what agencies measure and what actually matters. And it ends with the only number that should determine whether your email operation is succeeding or failing.
Why Open Rates Became the Default Metric — and Why That Was Always Wrong
Open rates did not start out as a deception. In the early days of email marketing, they were a reasonable proxy. If people were opening your emails, it meant your subject lines were working, your sender reputation was clean, and your list was reasonably engaged. The logic made sense when email was simpler.
Then two things happened.
First, email got competitive. As inboxes filled up, open rates became a battleground. Agencies competed on who could report the highest open rates — which led to subject line tactics that prioritised curiosity over conversion. The kind of subject line that gets opened out of confusion and closed without a purchase.
Second, Apple broke the metric entirely.
The Apple Mail Privacy Protection Problem
In September 2021, Apple released Mail Privacy Protection (MPP). When enabled — and most iPhone users have it enabled — it pre-fetches email content in the background, which triggers the open-tracking pixel regardless of whether the person actually opened the email.
The result: a significant portion of your “opens” are phantom opens. No one read your email. No one saw your offer. The pixel fired because a server pre-loaded your content to protect a user’s privacy.
Klaviyo data from 2023 showed that in some Shopify store segments, up to 40–60% of reported opens were Apple MPP-triggered — meaning they were not real human opens at all.
If nearly half your open rate is a ghost, the metric you’ve been reporting on for years is built on sand.
This is not a minor technical caveat. It is a fundamental reason why any agency still leading with open rates in 2025 is either uninformed or hoping you aren’t.
The Full Graveyard: Every Metric That Sounds Good but Predicts Nothing
Open rates are the most egregious example, but they are not the only number agencies hide behind. Here is the complete picture of what each metric actually tells you — and what it doesn’t.
| Metric | What it actually measures | Does it predict revenue? |
|---|---|---|
| Open rate | Whether a subject line triggered a click (or an Apple server) | No — an opened email that doesn’t convert earns $0 |
| Click rate | Whether a link was tapped | Weakly — clicks without purchases mean nothing |
| Unsubscribe rate | List decay speed | No — tells you about past damage, not future revenue |
| Revenue per recipient (RPR) | $ earned per email sent | Yes — the only metric tied directly to your bank account |
| Email-attributed revenue | Total $ generated by the email channel | Yes — the number that pays your invoices |
| Flow revenue contribution | $ generated per automated sequence | Yes — shows which flows are working and which are leaking |
Notice what the green rows have in common: they all end in a dollar sign. Revenue per recipient, email-attributed revenue, and flow revenue contribution are the only metrics that connect directly to your Shopify revenue dashboard.
Everything else is a measurement of activity, not outcome.
The Click Rate Trap
Click rate deserves special attention because it feels closer to revenue than open rate — and it is, slightly. But it is still not revenue.
Consider this: your promotional email goes out to 8,000 subscribers. 640 people click (8% click rate — strong by industry standards). Of those 640, 11 buy something at an average order value of $47. That email generated $517 in revenue.
Your agency reports an 8% click rate and calls it a win. But $517 from 8,000 recipients is a revenue per recipient of $0.065 — roughly a third of what a properly segmented email should produce at your stage. The click rate told you one thing. The revenue told you something completely different. Your agency reported the click rate.
The Only Numbers That Actually Predict Email Revenue
There are three metrics that belong at the top of every email report. Not because we say so — because they are the only numbers with a direct mathematical relationship to your Shopify revenue.
1. Revenue Per Recipient (RPR)
RPR = Total email-attributed revenue ÷ Total emails sent
This is the single most useful number in email marketing. It tells you, in dollars and cents, what each send is worth. Not what percentage opened. What each recipient was worth, on average, when you pressed send.
If your RPR is sitting at $0.06 and your list has 12,000 active subscribers, every campaign generates roughly $720. At $0.30 RPR — achievable for most stores with proper segmentation — that same campaign generates $3,600. Same list. Same send. Different setup.
2. Email-Attributed Revenue (Monthly Total)
This is your gross number. The total dollars your email channel generated this month, tracked through Klaviyo’s revenue attribution model.
The benchmark: email should be driving 30–40% of total Shopify store revenue for stores that have been running email for more than six months with proper flows in place.
If your store does $60,000/month and email is generating $4,200, that is a 7% contribution. The gap between 7% and 30% is not a marketing problem — it is a structural problem. That gap, in dollar terms, is $13,800/month sitting uncollected. Your open rate has nothing to tell you about that gap.
3. Flow Revenue Contribution (Per Automated Sequence)
This is where the real diagnostic power lives. Each automated flow should be generating a predictable, measurable amount of revenue every month. When you know these numbers, you immediately see which flows are working and which are structural leaks.
If your Abandoned Cart flow is generating $320/month against a benchmark of $1,200–$4,500, you don’t need better copy. You need a rebuilt flow with correct timing, proper segmentation between first-time and returning buyers, and offer logic that doesn’t train customers to abandon on purpose.
What Agencies Report vs. What They Should Report
The gap between what a retainer agency reports and what a performance-only operation reports is not a style difference. It is an incentive difference. A retainer agency gets paid regardless of revenue. Their reporting can be optimised to protect the relationship rather than interrogate the results.
| What they report | Typical retainer agency | Performance-only agency |
|---|---|---|
| Open rate | Always reported — looks good regardless | Noted only if it affects revenue |
| Click rate | Always reported — looks good regardless | Tracked but not the headline number |
| Revenue per recipient | Rarely mentioned | Primary success metric |
| Email-attributed revenue | Sometimes, often overstated | Every report leads with this number |
| Flow performance by $ | Never broken down this way | Reported per flow, per month |
| Invoice tied to… | Retainer — regardless of results | 10% of revenue generated only |
“But Our Open Rates Dropped When We Focused on Revenue Metrics”
This is a real objection and it deserves a direct answer.
Yes. When you stop optimising for open rates and start optimising for revenue, open rates frequently drop. Here is why that is not only acceptable — it is the intended outcome.
Optimising for open rates leads to subject lines that provoke curiosity without delivering relevance. “You won’t believe this…” gets opened. It does not get purchased. Over time, this trains your list to open emails out of reflex and ignore the content.
When you shift to revenue optimisation, you change the segmentation, the offer logic, and the send frequency. You stop sending to your entire list and start sending to people with a demonstrated reason to buy. Fewer people open. More people purchase.
- Open rate: 38%
- Monthly email revenue: $2,800
- Looks good. Performs poorly.
- Open rate: 22%
- Monthly email revenue: $14,500
- Earns 5× more.
The number that tells you which situation you’re in is never the open rate.
How to Audit Your Own Email Reporting in 10 Minutes
You don’t need to wait for your agency’s next report. You can run this audit right now inside Klaviyo.
Pull your email-attributed revenue for the last 90 days
Klaviyo → Analytics → Revenue. Filter by email channel. Divide the 90-day total by 3 for your monthly average. Compare to your total Shopify revenue. If email is below 20%, you have a gap worth investigating.
Calculate your RPR for the last 5 campaigns
Take attributed revenue ÷ total recipients for each campaign. Average the five results. Below $0.10 means underperforming. Below $0.05 means a serious structural problem — most likely poor segmentation or incorrect send frequency.
Check flow revenue contribution
Klaviyo → Flows → each flow → Analytics. Check revenue in the last 30 days. Compare against the benchmarks above. Any flow generating less than 40% of the low-end benchmark has a structural problem — not a copy problem.
Ask your agency one question
“What was our email-attributed revenue last month, and what percentage of total store revenue did that represent?”
If they can’t answer immediately, they are not managing your email channel. They are managing your email sends. Those are two completely different jobs.
What Happens When You Run Email on Revenue Logic
This is not theoretical. Here is what the transition looks like in practice for a mid-size Shopify store over 90 days.
- 3 campaigns/week to full list of 14,000
- Open rate: 41% (looks strong)
- Click rate: 3.2%
- Email revenue: $3,100/month
- RPR: $0.055
- Abandoned Cart: $280/month (1 email, no segmentation)
- No Browse Abandonment, Win-Back, or Post-Purchase flows
- 2 targeted campaigns/week to segmented audiences
- Open rate: 27% (lower — intentional)
- Click rate: 4.8% (higher — more relevant sends)
- Email revenue: $11,400/month
- RPR: $0.29
- Abandoned Cart: $2,900/month (3-email, buyer-history segmented)
- Browse Abandonment, Post-Purchase, and Win-Back all active
The open rate dropped 14 points. Revenue from email increased by $8,300/month. Annualised, that is $99,600 that the open rate never told you about.
See Exactly What Your Email Channel Is Actually Generating
If you ran the 10-minute audit above and didn’t like the number you found, there is a fast way to understand exactly where the gap is — and what it would take to close it.
We record a personalised Loom walkthrough of your actual Klaviyo account — flows, segments, campaign performance, and revenue attribution — and deliver a specific revenue diagnosis within 48 hours. No retainer. No sales call required.
You pay nothing for the audit. You pay nothing for our work until the revenue we generate is sitting in your Shopify account.