Email Marketing KPIs: The Metrics Every Shopify Brand Must Track in 2026
You’re sending emails. But do you actually know if they’re working? Most Shopify stores track the wrong numbers — and make the wrong decisions as a result. This is the complete 2026 guide to email metrics that actually predict revenue.
There is a specific moment in every Shopify store owner’s relationship with email marketing when they realise they have been measuring the wrong things. They have been watching open rates go up and down, celebrating when the number climbs, worrying when it drops — and through all of it, email has quietly contributed 7% of their store revenue instead of the 25–40% it should be generating.
The problem is not their emails. It is their scorecard.
This guide rebuilds that scorecard from the ground up — with the 8 metrics that actually predict email revenue, the 2026 benchmarks for each, and a reporting framework you can implement this week.
1. Why Most Shopify Stores Track the Wrong Email Metrics
Open rate became the default email metric for a simple reason: it was the easiest number to see. Every email platform puts it at the top of the dashboard. It moves visibly after every send. It feels like a direct measure of whether your email is working.
It is not — and in 2026, it is less reliable than it has ever been.
The Apple Mail Privacy Protection problem
In September 2021, Apple introduced Mail Privacy Protection (MPP), which automatically pre-loads email content — including the tracking pixel that records opens — for all Apple Mail users, regardless of whether the subscriber ever actually opens the email. A study of over 80,000 email marketing accounts found that open rates jumped 18 percentage points in the six months after MPP launched, moving the average above 40% industry-wide — not because engagement improved, but because machines were registering phantom opens.
Apple Mail currently accounts for approximately 46% of all email client usage. That means nearly half of your “opens” may be machine-triggered events with no human being involved. In 2026, open rate is considered a soft metric — useful for detecting deliverability issues (if open rate collapses suddenly, something is wrong with inbox placement) but not reliable as a primary performance indicator.
The metric hierarchy that actually matters
Here is how to rank the importance of email metrics for a Shopify store:
Revenue Per Recipient (RPR)
The primary metric. Everything else explains it.
Conversion rate + Email % of store revenue
Revenue outcomes.
Click-through rate + Click-to-open rate
Real engagement signals.
Unsubscribe rate + Bounce rate + List growth rate
List health indicators.
Open rate
Directional only. Use as warning signal, not success signal.
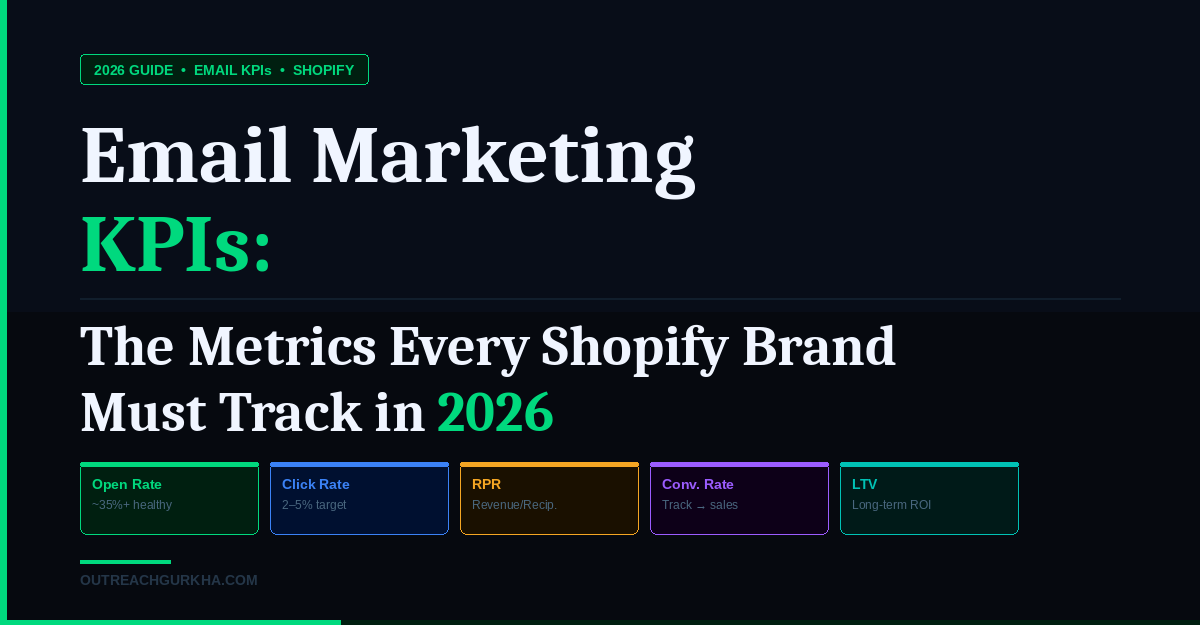
2. The 8 Essential Email KPIs for Shopify — With 2026 Benchmarks
| KPI | Ecommerce average | Good | Excellent | Warning threshold |
|---|---|---|---|---|
| Open rate | 42–43% (MPP-inflated) | 25–35% (clean) | 35%+ (clean) | Below 15% (deliverability issue) |
| Click-through rate (CTR) | 2.09–2.5% | 2.5–4% | 4%+ | Below 1% (content problem) |
| Revenue Per Recipient (RPR) | $0.08–$0.11 campaigns | $0.15–$0.25 | $0.30+ campaigns | Below $0.05 (segmentation broken) |
| Conversion rate | 2–4% | 3–5% | 5%+ | Below 1% (offer or landing page) |
| List growth rate | 1–2%/month | 2.5–4%/month | 5%+/month | Negative or flat (acquisition broken) |
| Unsubscribe rate | 0.22% (2026 avg) | Below 0.3% | Below 0.1% | Above 0.5% (content mismatch) |
| Hard bounce rate | 1–2% | Below 0.5% | Below 0.2% | Above 2% (list hygiene critical) |
| Email LTV contribution | 7–12% of store revenue | 25–30% | 35–40% | Below 10% (structural problem) |
Sources: Klaviyo 2026 Benchmark Report (183,000+ accounts), MailerLite 2025 (3.6M campaigns), ActiveCampaign 2026 (3.3M campaigns).
Now the deep dive on each one.
KPI 1 — Open Rate
What it measures: The percentage of delivered emails that were opened (or had their tracking pixel pre-loaded).
2026 reality: Average open rates now sit at 43.46% across industries — but this figure is significantly distorted by Apple MPP pre-loading. The true human-open rate for most ecommerce lists is likely 20–30 percentage points lower than what Klaviyo reports.
How to use it correctly: Treat open rate as a deliverability signal, not a success signal. If it drops suddenly by 10+ percentage points on a consistent list, something is wrong with your inbox placement, authentication, or sender reputation. If it holds steady or climbs gradually, your domain health is good. Never compare open rate numbers across different time periods without accounting for the MPP distortion baseline.
What actually matters here: Click-to-Open Rate (CTOR) — the percentage of openers who clicked something. This strips out machine-triggered opens and measures only people who both opened and engaged. A healthy CTOR for ecommerce is 8–12%. Below 5% means your content is not resonating with people who did open. Above 15% means your content and audience alignment is excellent.
KPI 2 — Click-Through Rate (CTR)
What it measures: The percentage of total delivered emails where at least one link was clicked.
2026 benchmark: Average CTR across all industries sits at 2.09%. For ecommerce specifically, 2.5–4% is considered good, and 4%+ is excellent.
Why it matters more than open rate in 2026: CTR reflects actual human behaviour — a person physically clicking a link in your email. It cannot be faked by a privacy protection pre-loader. It is the most reliable engagement signal available after open rates became unreliable, and it is the metric most directly predictive of conversion and revenue.
What drives CTR: The single CTA rule (one action per email, not five), CTA button copy that states a specific benefit rather than a generic action (“Get my 10% off” outperforms “Shop Now”), and email content that creates genuine desire before asking for the click.
KPI 3 — Revenue Per Recipient (RPR)
What it measures: Total email-attributed revenue divided by total emails sent. The single most diagnostic metric in ecommerce email marketing.
2026 benchmarks:
RPR benchmarks — Klaviyo 2026 data (183,000+ accounts)
How to calculate it: In Klaviyo, go to Analytics → Revenue → filter by campaign or flow → divide attributed revenue by recipients sent. Run this calculation for your last 5–10 campaign sends and average the results. If your campaign RPR is below $0.05, you have a segmentation problem — you are sending to too many unengaged contacts who will never buy.
The RPR diagnostic: If RPR is low, the culprit is almost always one of three things: sending to the full list instead of the Engaged segment, an offer that does not match the audience’s stage in the customer journey, or a flow with no exit condition that keeps sending to people who already purchased.
KPI 4 — Conversion Rate
What it measures: The percentage of email recipients who completed a purchase attributed to that email within Klaviyo’s attribution window.
2026 benchmark: 2–4% for campaigns. Flows significantly outperform campaigns: abandoned cart flows achieve 15–20% conversion rates on the sequence as a whole, and welcome series flows convert 8–12% of new subscribers to first-time buyers.
Attribution window note: Klaviyo’s default attribution window is 5 days — meaning any purchase within 5 days of an email click is attributed to that email. For stores with longer consideration cycles (furniture, high-end accessories), extending this to 7–14 days may more accurately reflect email’s actual contribution. Match the attribution window to your product’s average time-to-purchase.
KPI 5 — List Growth Rate
What it measures: The net monthly percentage growth of your subscriber list, accounting for both new subscribers and unsubscribes.
Formula: (New subscribers − Unsubscribes) ÷ Total list size × 100
2026 benchmark: Industry average is 1–2%/month. Good is 2.5–4%/month. Excellent is 5%+/month. A negative list growth rate — where unsubscribes exceed new subscribers — is a critical signal that requires immediate attention to your signup forms, lead magnet quality, or email frequency.
Why list growth rate matters for Shopify specifically: A static list is a decaying list. Subscribers naturally become less engaged over time regardless of content quality. New subscribers enter your list in the highest-engagement window — welcome series open rates are 83%+ — which means consistent list growth continuously refreshes the high-engagement segment that drives your best RPR numbers.
KPI 6 — Unsubscribe Rate
What it measures: The percentage of recipients who clicked the unsubscribe link after a specific send.
2026 benchmark: The average unsubscribe rate in 2025 was 0.22%, more than double the 2024 rate of 0.08% — largely due to Gmail’s new one-click unsubscribe feature making it easier than ever to opt out. Below 0.5% is considered healthy; anything above that signals content-audience mismatch.
What a spike means: A sudden jump in unsubscribe rate on a specific send — particularly one above 0.5% — is a direct message from your list. The most common causes: sending to your full list instead of a segment, a promotional email that felt tone-deaf after a relationship-building sequence, an increase in send frequency without a corresponding increase in value, or an offer that was irrelevant to the audience who received it.
What you should not do: Suppress the unsubscribe rate by making the unsubscribe process difficult. Subscribers who cannot unsubscribe easily will mark your email as spam instead — and a spam complaint rate above 0.1% is a hard threshold that Gmail and Yahoo use to degrade your inbox placement.
KPI 7 — Deliverability and Bounce Rate
What it measures: Hard bounce rate is the percentage of emails rejected permanently (invalid addresses). Deliverability rate is the percentage of sent emails that successfully reached the inbox — not the spam folder.
2026 benchmarks: A good deliverability rate is above 89%. Excellent is above 95%. Below 80% is considered poor. Hard bounce rate should stay below 2%, with excellent lists below 0.5%.
The invisible deliverability problem: Nearly 1 in 6 marketing emails never reaches the inbox — they are routed to spam or promotions folders silently, with no error message in your Klaviyo dashboard. The send shows as “Delivered” because it reached the mail server, not because it reached the inbox. This is why domain authentication (SPF, DKIM, DMARC) is non-negotiable — unauthenticated sending domains fail inbox placement tests at Gmail, Yahoo, and Outlook even when technical delivery succeeds.
How to monitor it: Send a test email to a personal Gmail and Outlook address after every major campaign to verify inbox placement. If either routes to spam or promotions, investigate your authentication status in Klaviyo → Settings → Email → Sending Domains before your next send.
KPI 8 — Customer LTV from Email Channel
What it measures: The average lifetime value of customers acquired or retained through email — compared to customers from other channels. The most important long-term metric and the least tracked.
Why it matters more than any single-send metric: Email’s revenue impact is not just the $0.11 RPR on a single campaign. It is the difference in lifetime behaviour between a customer who went through a well-built post-purchase email sequence and one who did not. Customers who receive a proper post-purchase onboarding email have lower return rates, higher second-purchase rates, and higher satisfaction scores — all of which compound into materially higher LTV.
How to calculate it in Klaviyo: Create a segment of “customers who have received at least one email from us” and compare their average LTV (Klaviyo’s predicted LTV property) against the overall store average from Shopify Analytics. The gap between these two numbers is the compounding lifetime value that email generates beyond the immediate attributed revenue figure.
The benchmark that matters most: Email as a percentage of total store revenue. Klaviyo’s data across 183,000+ accounts shows the industry average is 27% — but stores with properly configured flows and segmentation consistently achieve 35–40%. Flows generate nearly 41% of total email revenue from just 5.3% of sends, with average RPR that’s nearly 18× higher than campaigns. If your email channel is below 15% of store revenue, the problem is structural — not creative.
3. How to Set Realistic Email Goals for Your Shopify Store
Generic benchmarks are useful reference points, not targets. The right goal for your store depends on your current baseline, your product category, and your list maturity. Here is a framework for setting goals that are specific enough to drive action.
Establish your current baseline (Week 1)
Pull your last 90 days of email performance from Klaviyo Analytics. Calculate: average campaign RPR, email as % of store revenue, list growth rate for the period, average unsubscribe rate, and flow vs. campaign revenue split. These are your starting numbers — not benchmarks, not averages. Your actual performance today.
Set 90-day improvement targets per metric
Targets should be ambitious but grounded in what specific changes will produce them. “Increase RPR from $0.08 to $0.18” is a goal. “Increase RPR” is not. “Grow email as a % of store revenue from 9% to 20% within 90 days by building the welcome series and abandoned cart flows” is a plan with a measurable outcome. Every target needs a specific action attached to it.
Prioritise by revenue impact, not difficulty
The highest-impact changes for most Shopify stores: switching campaign sends from full list to Engaged segment (immediate RPR improvement), building or fixing the abandoned cart flow (highest per-message revenue of any email type), and fixing domain authentication if it is not passing (silent deliverability recovery). None of these require better copywriting. They are structural changes that improve results on every email you have already written.
4. A Simple Email Reporting Template for Shopify Stores
A reporting template that gets used is better than a comprehensive one that gets ignored. Here is the minimum viable monthly email report — structured so that any team member can populate it in under 20 minutes using Klaviyo’s Analytics dashboard.
The report leads with revenue — not open rates. Section A is a four-number executive summary that tells the complete story of your email channel’s health in under a minute. Sections B and C provide the diagnostic detail. Section D is the action plan. Any report that does not end with clear next actions is a description, not a management tool.
5. Red Flags That Mean Your Email Programme Needs Help
These are the specific combinations of metrics that indicate structural problems — not creative problems, not seasonal fluctuations. If you see these patterns, the fix is not a better subject line.
Email KPIs Quick Reference — 2026
Free email performance audit
Get a Free Email Performance Audit from Outreach Gurkha
We audit your Klaviyo account across every KPI in this guide — your current RPR, email contribution percentage, flow configuration, list health metrics, and the specific structural gaps costing you revenue every month.
We deliver it as a personalised Loom video: every number compared against the 2026 benchmarks, every gap quantified in monthly revenue terms, and a specific priority list of what to fix first.
Free. No obligation. Delivered in 48 hours.
For Shopify stores doing $10K–$150K/month.
We only charge 10% of revenue we generate — after it arrives.